See who's on your website
All six exits Exit 1

What we did for a car dealership

A multi-lot independent used-car dealer in South Carolina. One script on its website, its own customer list, and a desk its sales team works every day. Every number below was read from that desk on October 5, 2026, about ten days after the pixel went on.

649website shoppers named, each with an email and a home address
81past customers found shopping for a car again, in the first 7 days
30,768of the dealer's customer records checked every morning
229records thrown out before the dealer ever saw them

At this pace, six months

11,000
named website shoppers
7,000
of them opening a vehicle page
150
past customers back on the dealer’s website

An estimate, not a result. It is the daily average of the first ten and a half days carried for 182 days and rounded down, and it assumes the dealer’s traffic and advertising hold. A shopper who returns is named once, so the real count is likely to run lower. The 72 past customers found shopping elsewhere are left out: that count grew as in-market data was added, which is not a daily rate to carry forward.


The situation

The website counted visits. The CRM held customers. Nobody could see either one moving.

????Visits, no namesCustomers, no signal

Like every dealer website, this one reported how many people came and nothing about who they were. A shopper could open nineteen vehicles in a night and leave without a form, and the store would never know.

The dealer's CRM held more than thirty thousand customers across two stores. Some of them were back in the market for a car that week. Nothing told the sales team which ones.

What we put in

  • The Leads Avenue Pixel on the dealer's website, from September 25
  • A second-source check on every new shopper. Anyone scoring under 4 is dropped, not delivered
  • A match of every shopper against the dealer's own customer lists
  • A daily check of those lists against people shopping for a car in the market
  • A password-protected desk, rebuilt automatically three times a day
The leads

649 named shoppers in about ten days. From traffic the dealer already had.

The pixel resolved 878 website visitors to a person. We dropped 229 that failed our quality check. The 649 that reached the desk each carry a name, an email and a home address, and 629 of them a mobile number.

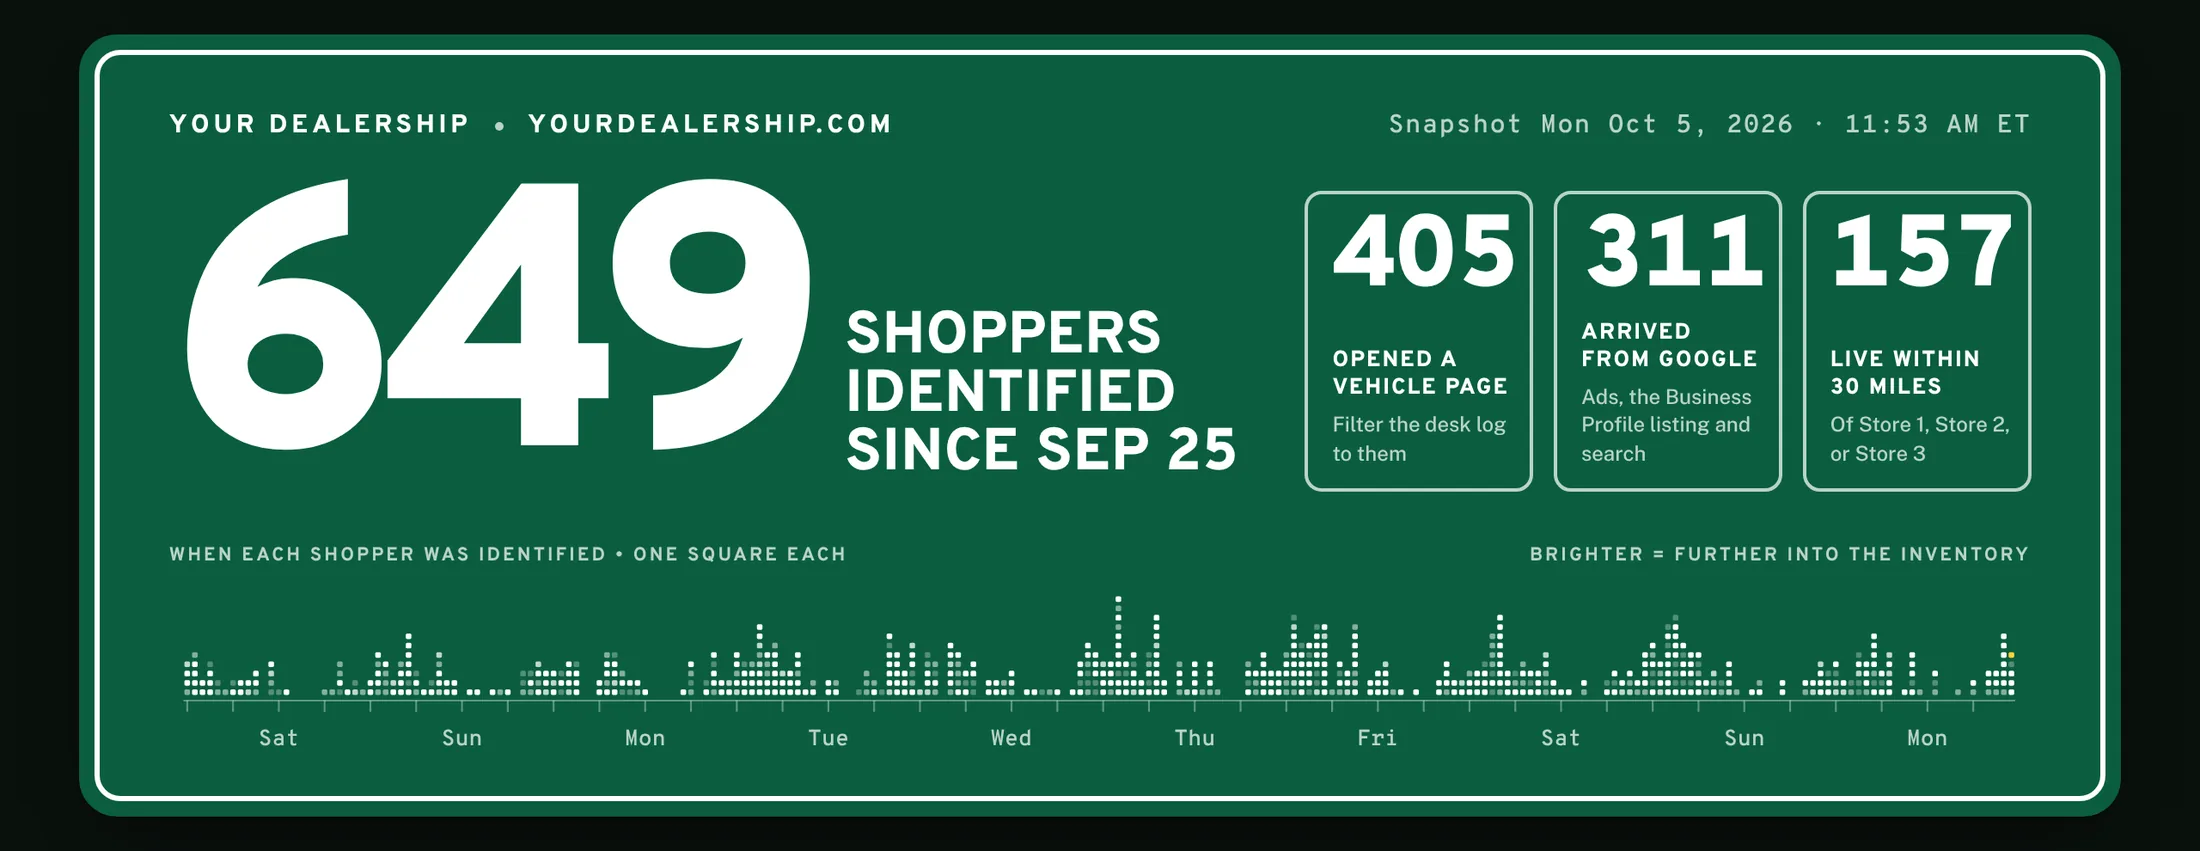
The desk's summary sign: 649 shoppers identified since September 25. 405 opened a vehicle page, 311 arrived from Google, 157 live within 30 miles of a store. A timeline shows one square for each shopper across eleven days.

How hard they shopped: vehicles opened, of the 649 named

  • Opened at least one vehicle page405
  • Opened three or more vehicles149
  • Opened five or more100
  • Opened ten or more37
87
came back on two or more different days
157
live within 30 miles of a lot
395
different vehicles opened across all shoppers
6,120
page views tracked, each tied to a named person
CRM flag

81 past customers, shopping for a car again. Found in the first 7 days.

The dealer's customer lists arrived on September 28. Seven days later the desk had flagged 81 of those customers as back in the market: 9 on the dealer's own website, and 72 who were shopping elsewhere and had not come back yet. The sales team could time the call perfectly.

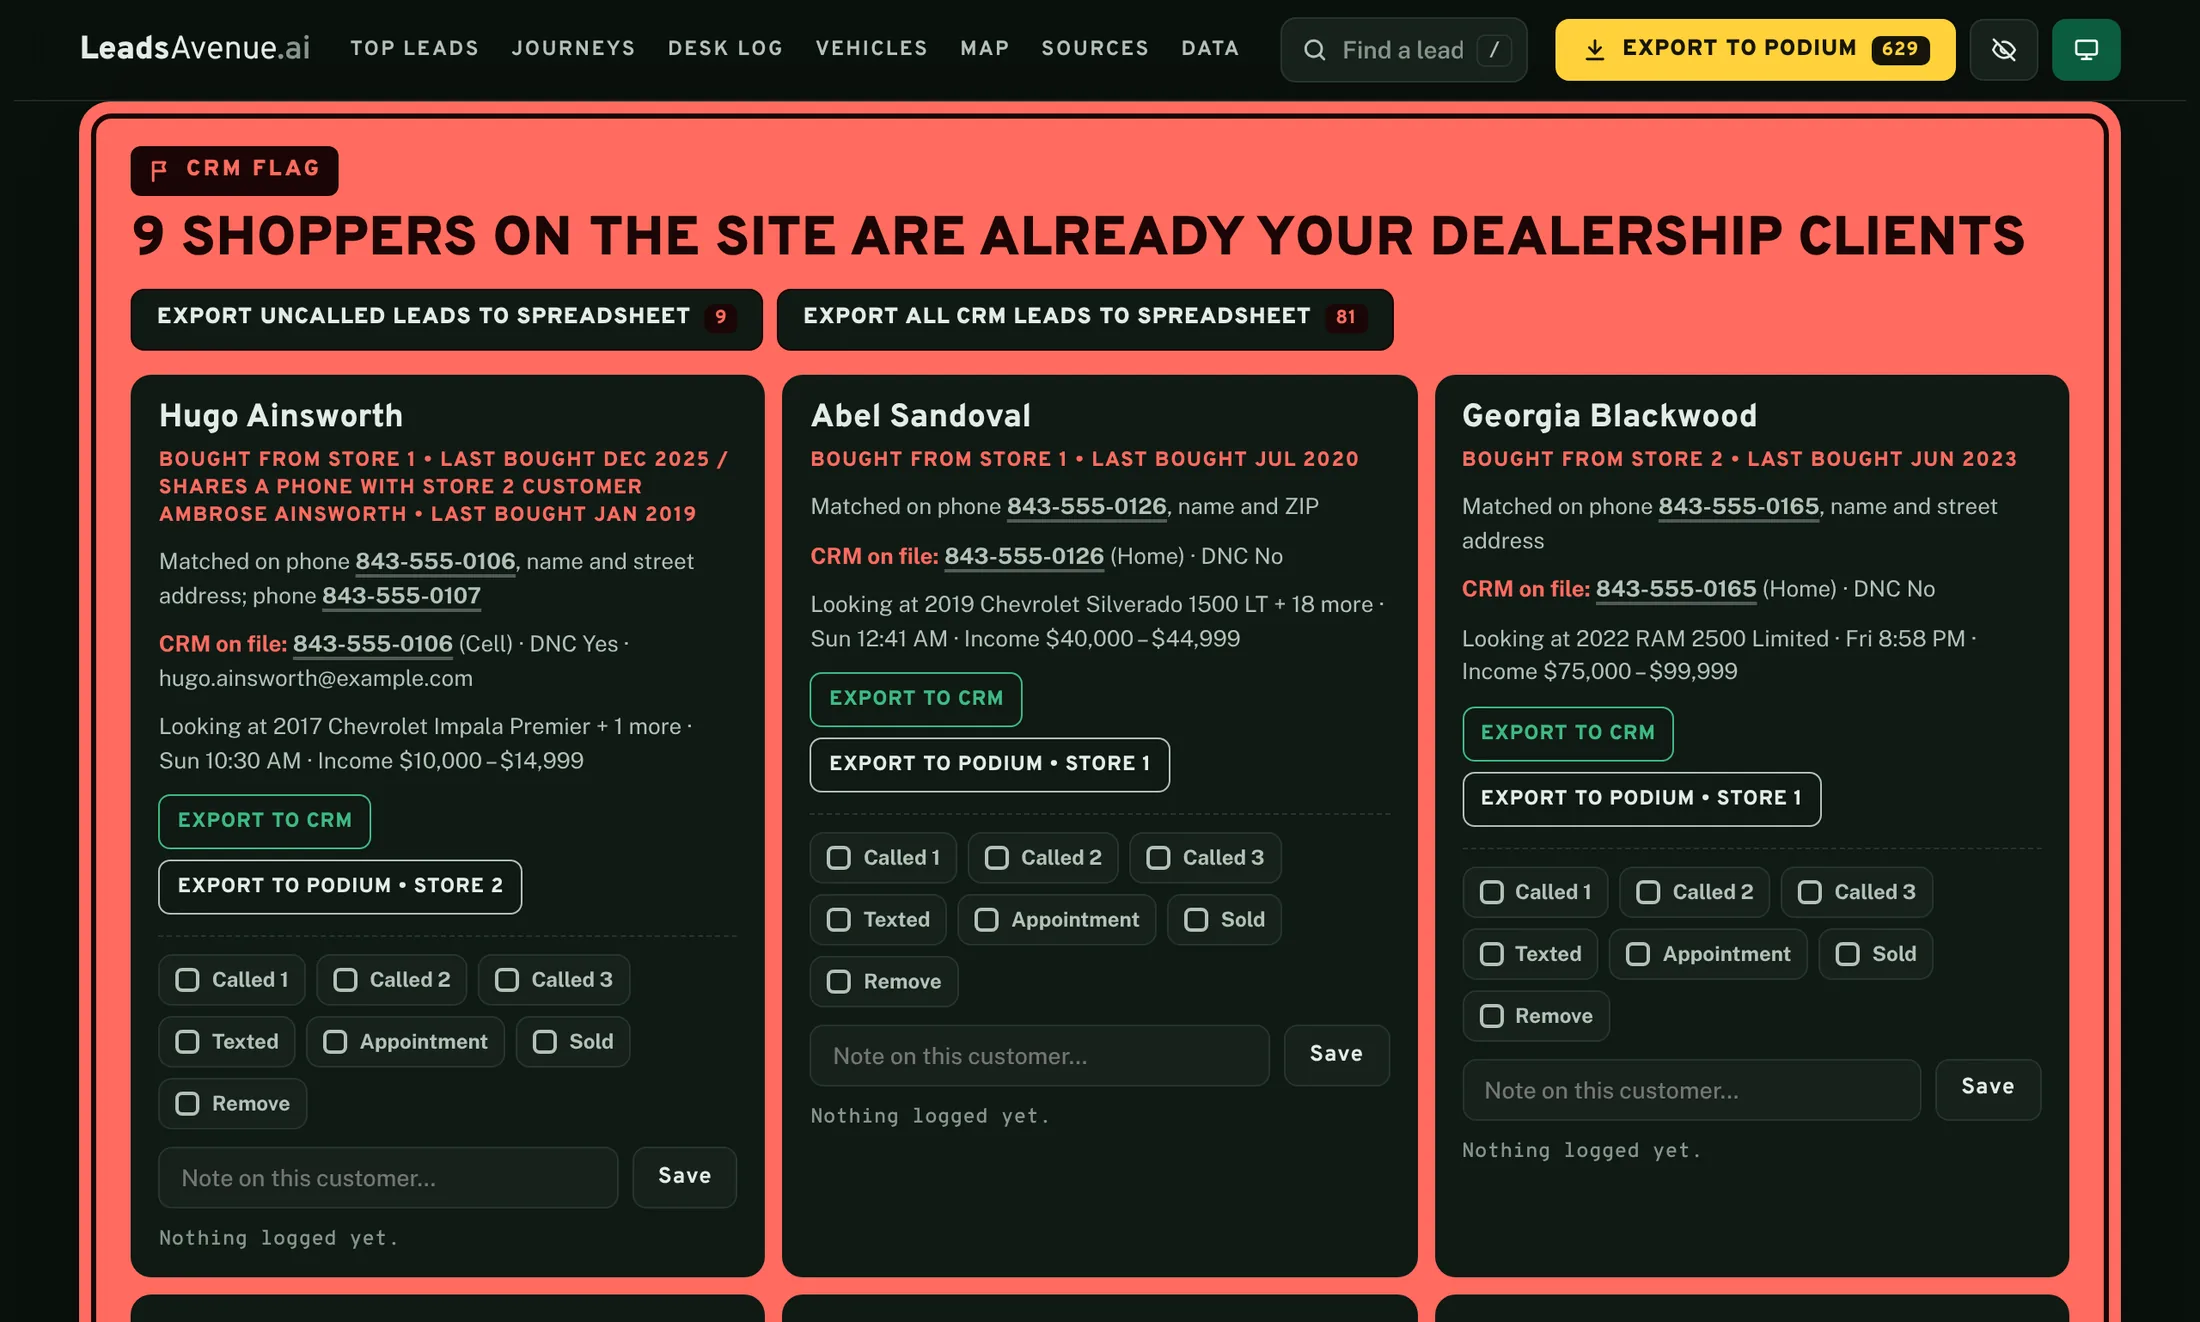
The CRM FLAG panel at the top of the desk: 9 shoppers on the site are already Your Dealership clients. Three sample cards show where and when each customer last bought, the number on file, the vehicle they are looking at now and follow-up checkboxes.
On the website. The card leads with the dealership's own record: where they bought and when. Under it, the vehicle they are looking at right now and a follow-up log every salesperson shares.
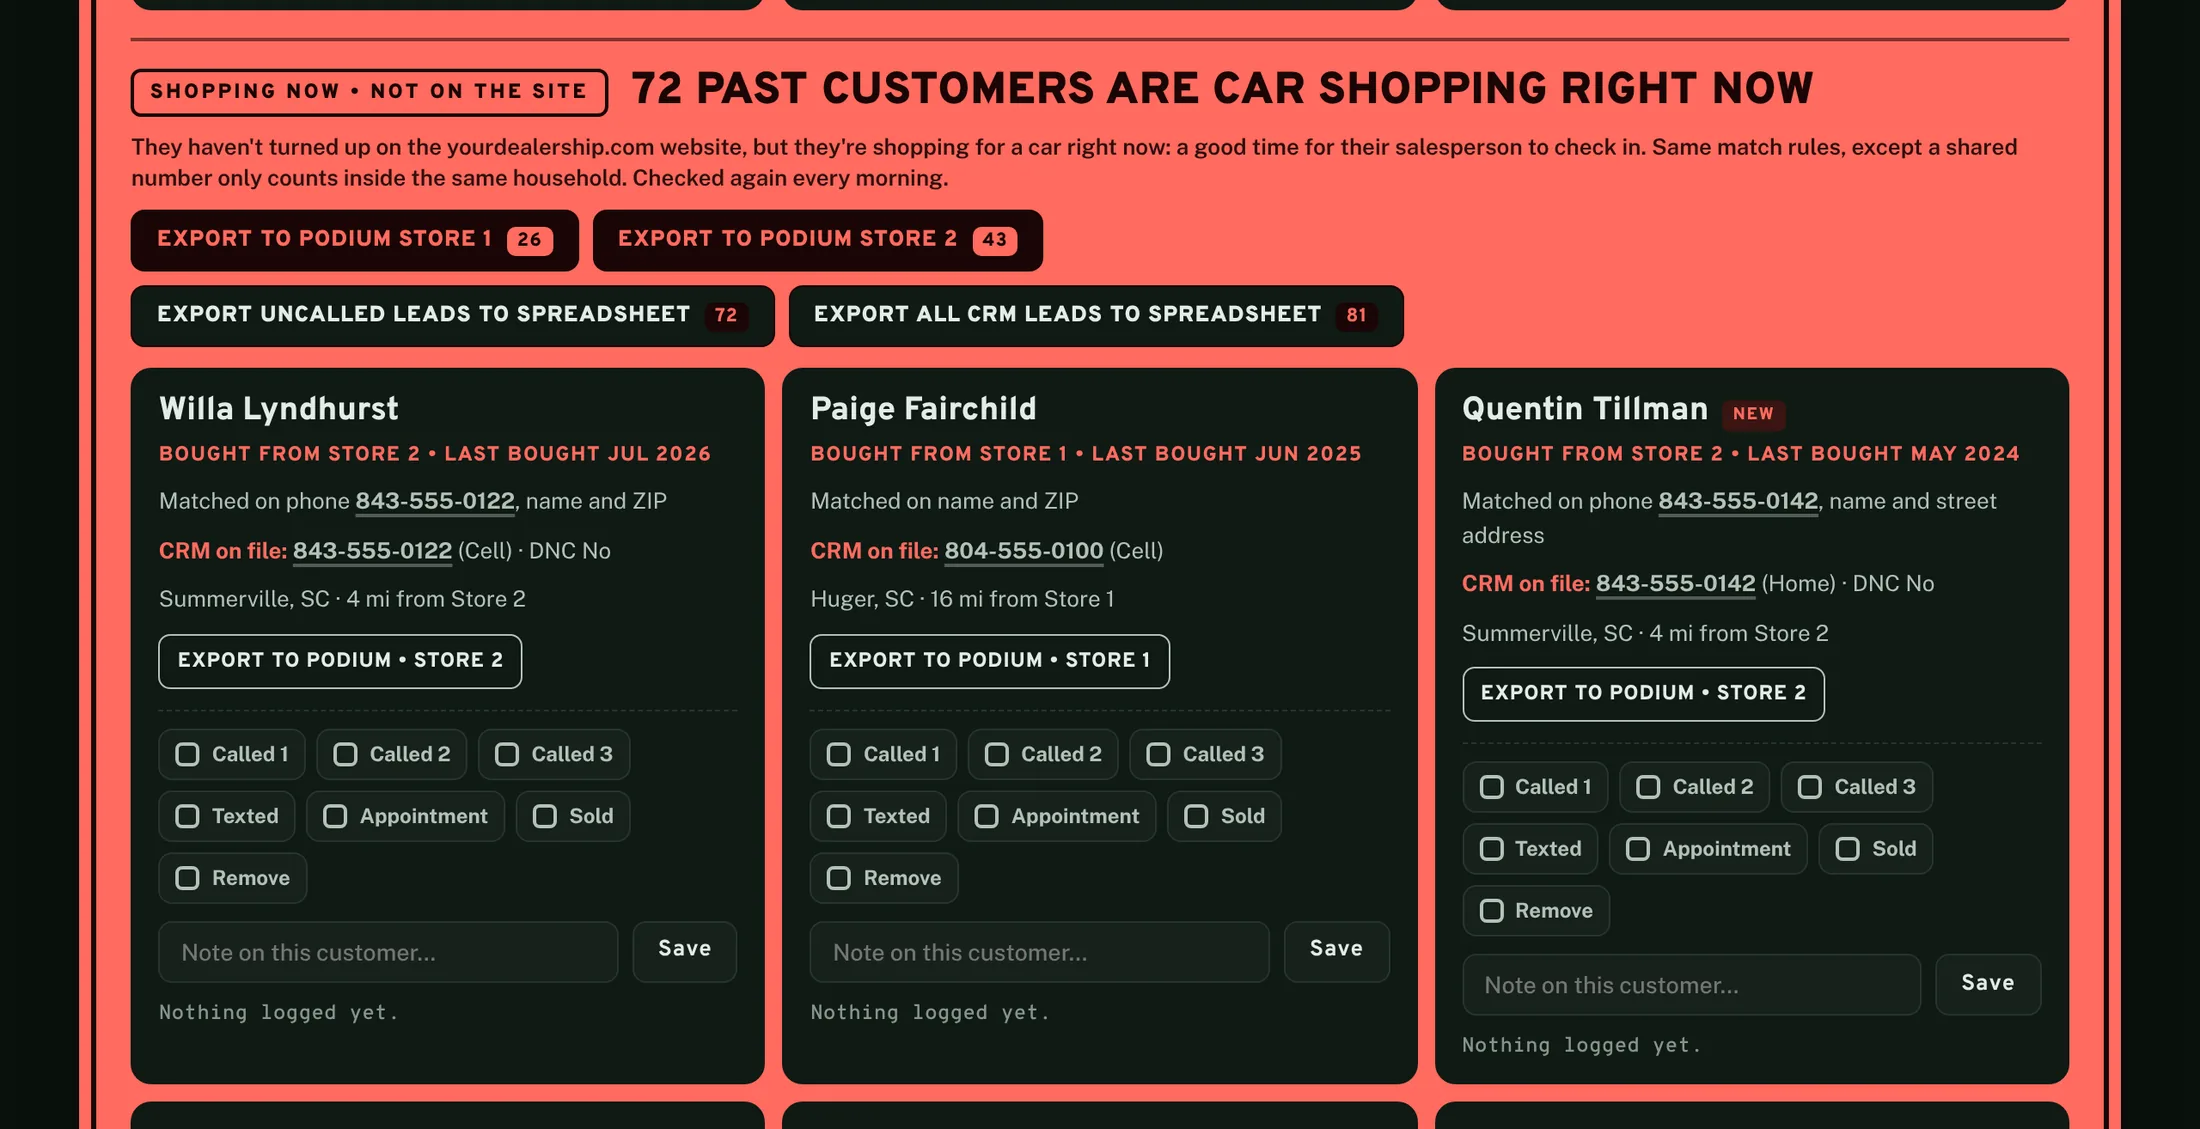
A second panel: 72 past customers are car shopping right now. They have not turned up on the dealer's website but are shopping for a car: a good time for their salesperson to check in. Three sample cards show last purchase dates, numbers on file and follow-up checkboxes.
Not on the website yet. These customers were found shopping in the market, so the store can call before a competitor does. The desk shows who they are and what they bought from the dealer. It never shows what they are shopping for.
  1. 10 monthsBought December 2025ImpalaSilverado

    Back on the website ten months later, on two different days, looking at an Impala and a Silverado.

  2. 6 yearsBought July 202019 vehicles in one night

    Opened 19 different vehicles in one night. A six-year-old sale became a shopper the store could call the next morning.

  3. 3 yearsBought June 20232022 RAM 2500 Limited

    Came back and went straight to one truck, a 2022 RAM 2500 Limited.

  4. 5 yearsA 2021 buyer's household6 trucks in one day2022 Tundra Hybrid Capstone

    Opened six trucks in one day, among them a 2022 Tundra Hybrid Capstone.

How a match is made

A match needs the same phone or email, or the same name at the same street address or ZIP. A name alone never counts. The list of customers shopping elsewhere started at 26 on September 29 and reached 72 by October 5 as more in-market data was added. It is now checked every morning.

What we add to the CRM

We audited 33 flagged leads against the dealer's own records. Our data carried 3.3 phone numbers for each customer against 0.9 in the CRM, and an email address for 26 of them against 4. A flagged lead never drops off the desk until the dealer removes it.

The website journey

Which car they looked at. How long. When they came back.

The desk maps every named shopper's visit across the dealer's website, minute by minute. Whoever picks up the phone knows which vehicle to talk about before the first hello.

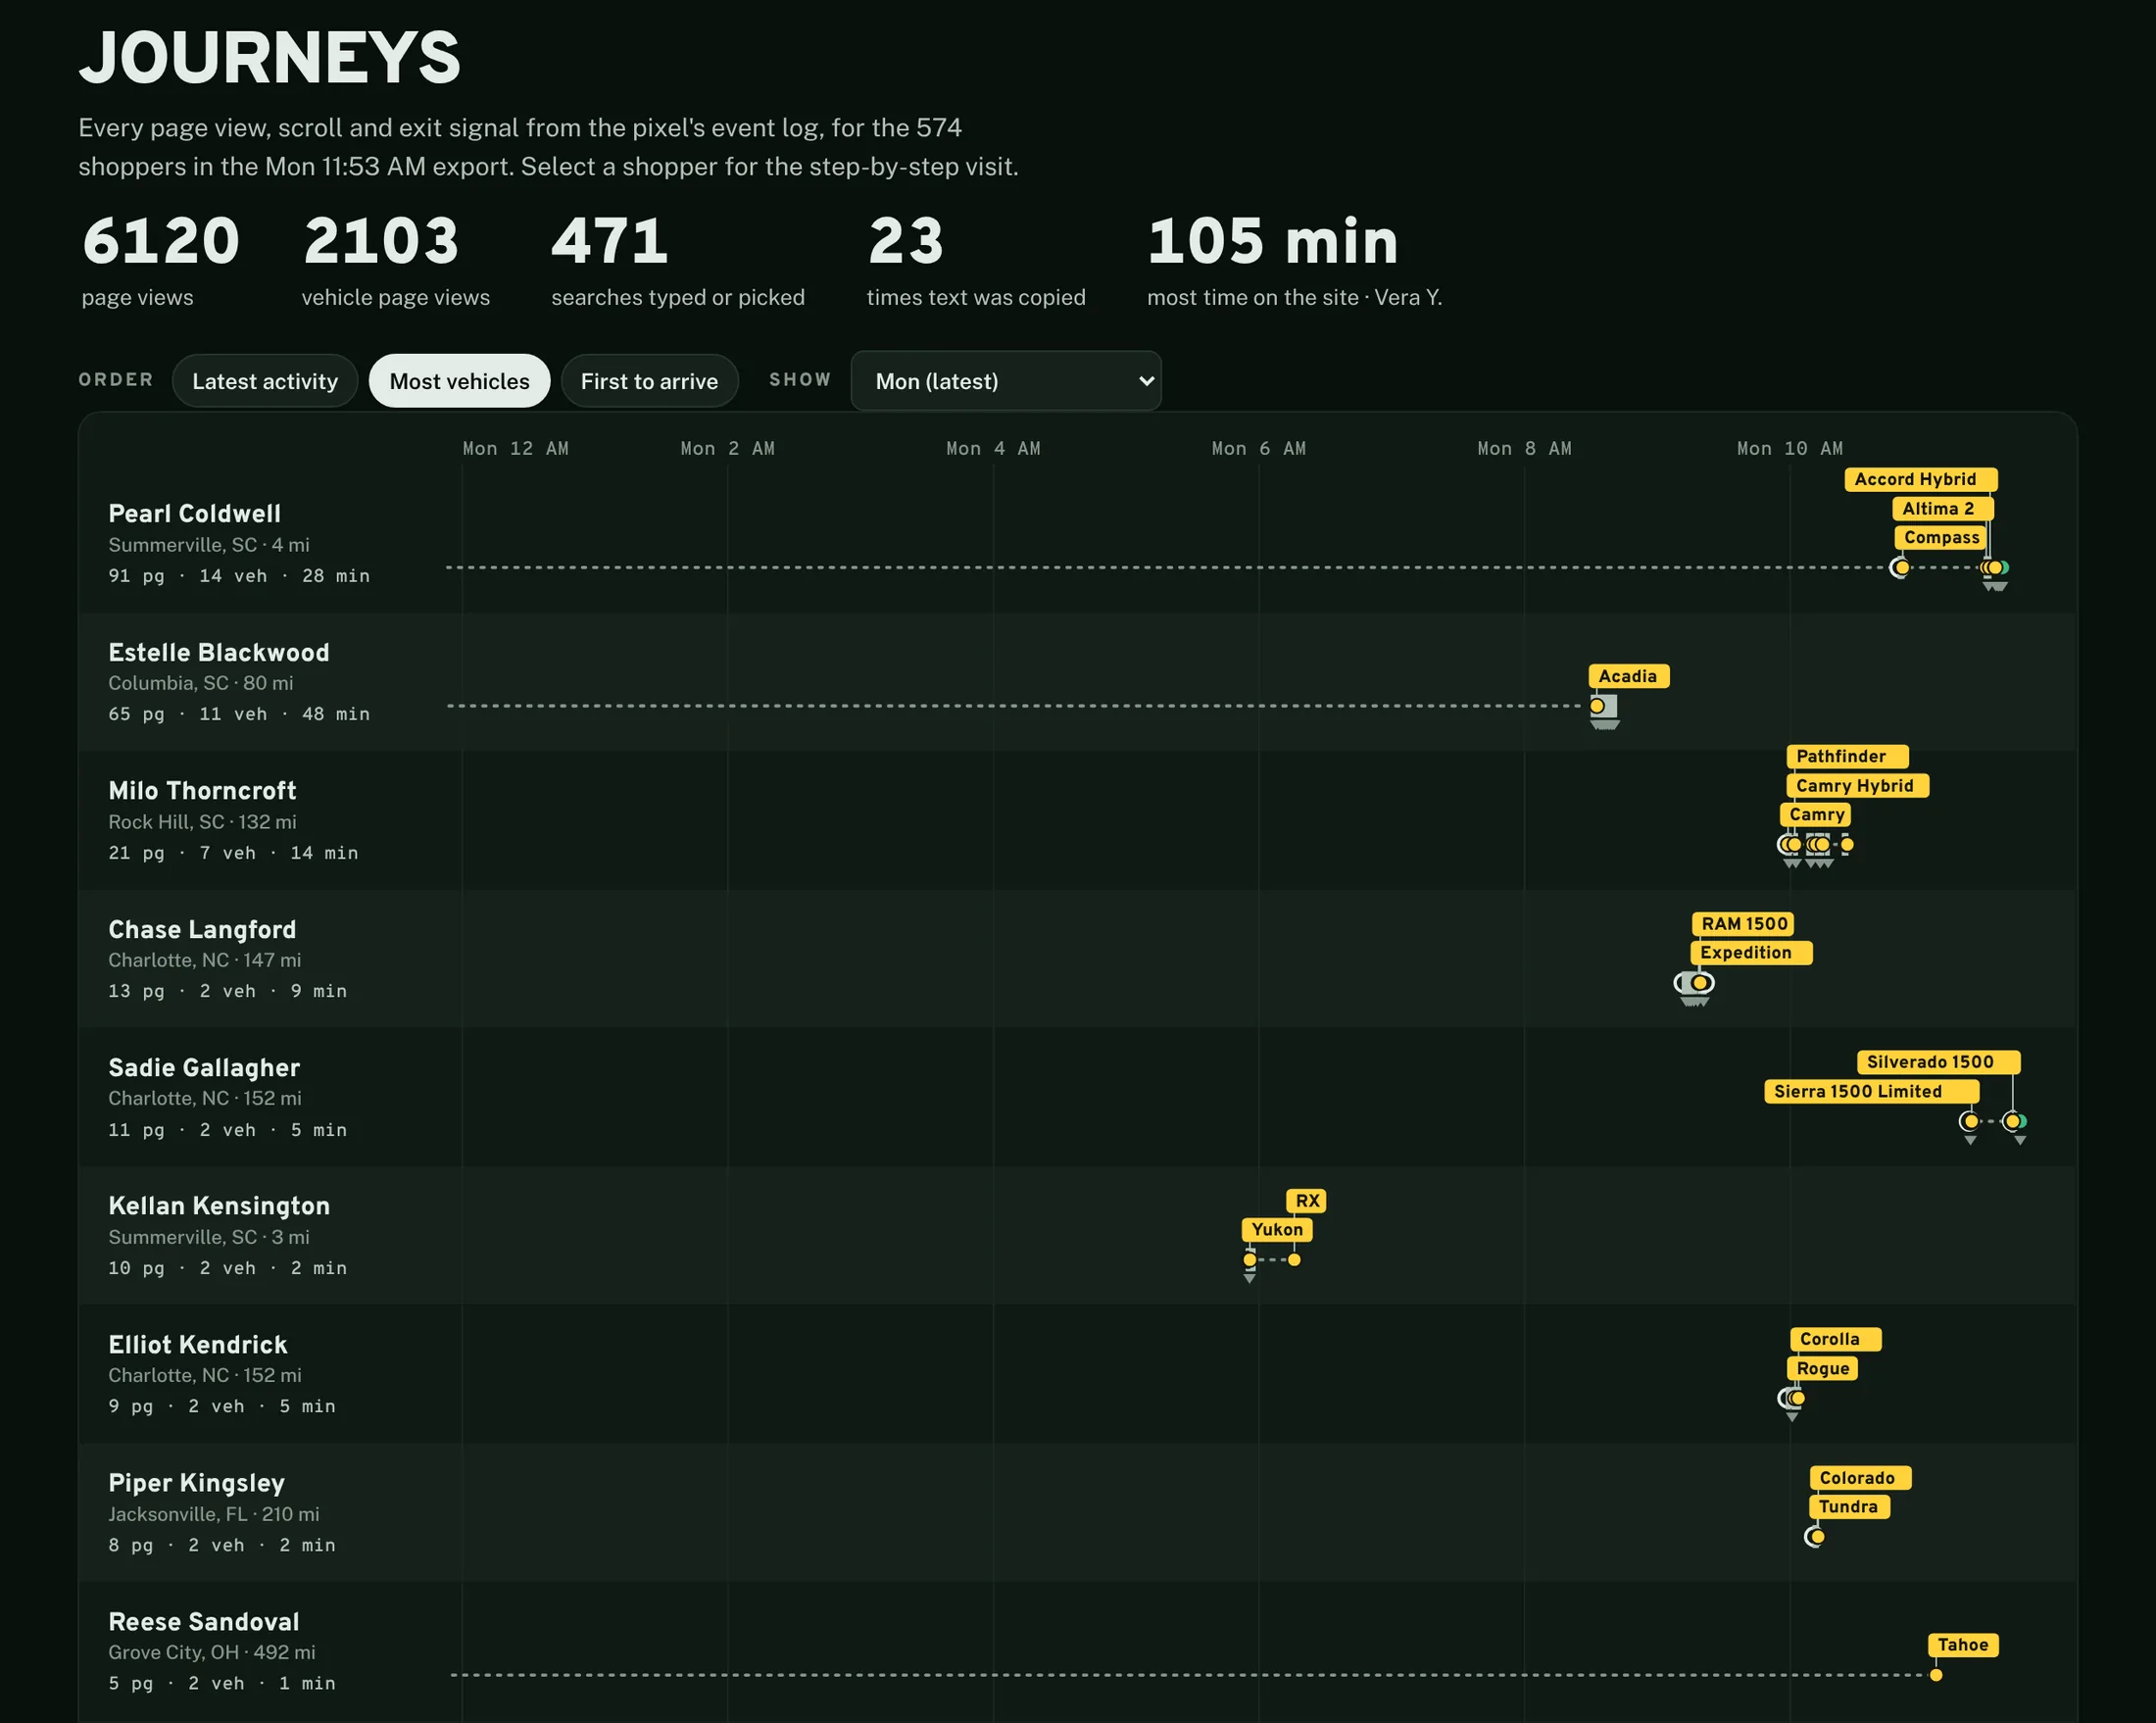
Journeys. Each row is one sample shopper's visit along a timeline of the morning. Yellow tags name the vehicles each one opened: Accord Hybrid, Altima, Compass, Acadia, Pathfinder, Camry Hybrid, RAM 1500, Expedition, Silverado 1500, Sierra 1500 Limited. Totals: 6120 page views, 2103 vehicle page views, 471 searches.
One row for each shopper. Yellow tags are the vehicles they opened. A dotted line means they left and came back. 6,120 page views in all, 2,103 of them on vehicle pages.
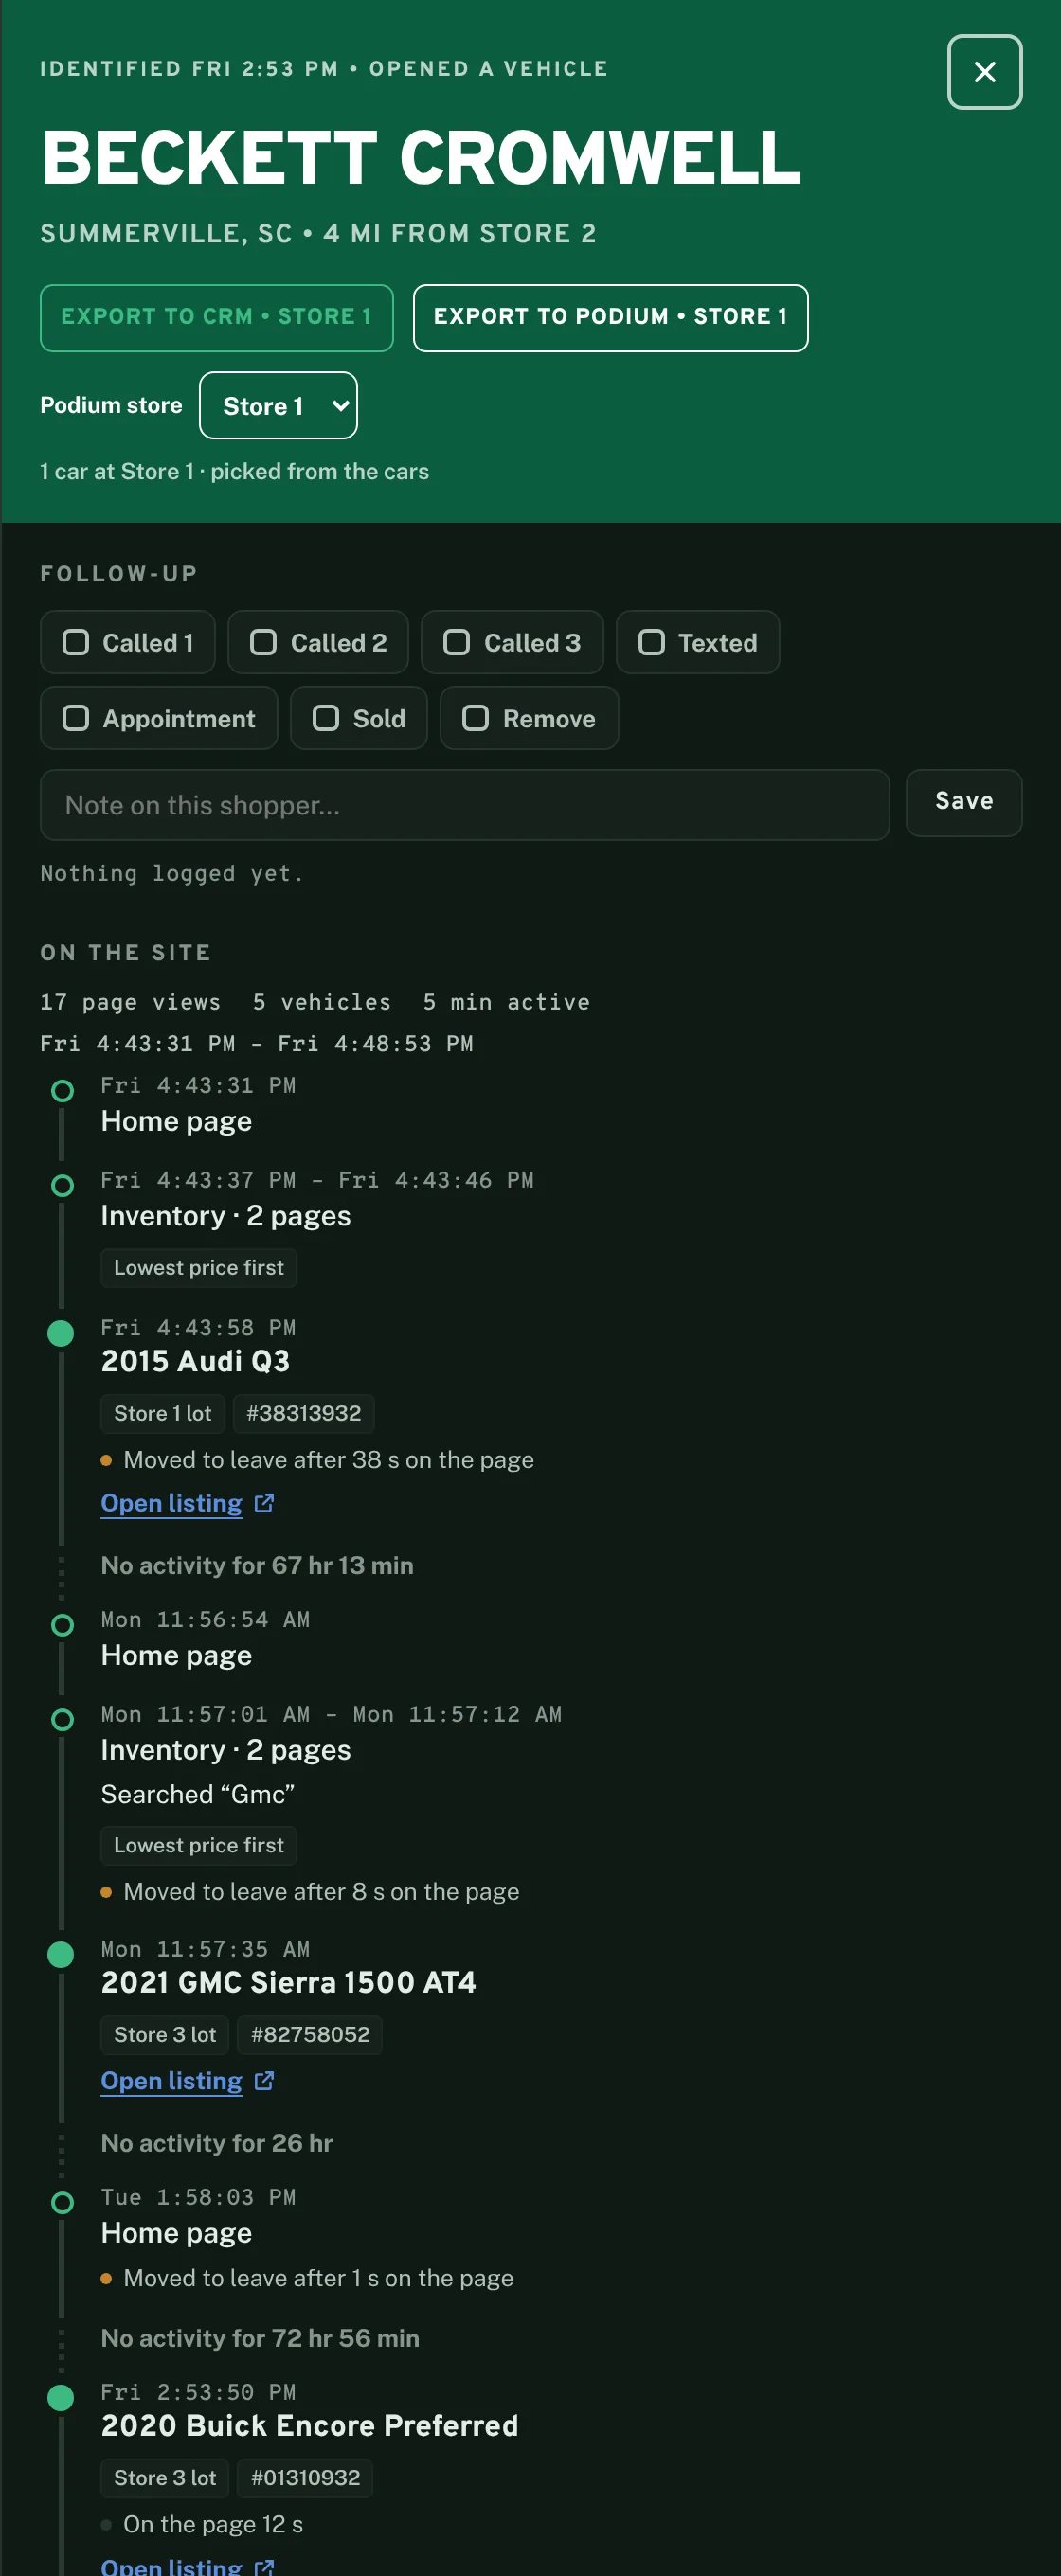
One sample shopper's record. Friday 4:43 PM: home page, then inventory sorted by lowest price, then a 2015 Audi Q3 on the Store 1 lot. No activity for 67 hours. Monday: searched GMC, opened a 2021 GMC Sierra 1500 AT4. Later in the week: a 2020 Buick Encore Preferred and a 2011 Toyota Tundra.

Open any shopper and read the visit like a desk log

This sample shopper came five times in eight days. Friday afternoon: the home page, the inventory sorted by lowest price, then an Audi Q3. Sixty-seven hours of nothing. Monday: a search for “GMC” and a Sierra 1500 AT4. By the next Friday, a Buick Encore and a Tundra.

The record shows what they searched for, which lot each vehicle sits on, how long they stayed on the page, and the moment they moved to leave.

87
shoppers came back on two or more days
26
came back on three or more
Who to call first

278 leads ranked and ready. Past customers on top.

The desk does not hand the store a list of 649 names and wish it luck. It ranks them: past customers first, then every shopper who opened a vehicle and has a household income of $36,000 or more, closest to a lot first. This dealer sells to every credit situation, so income is the filter, not credit.

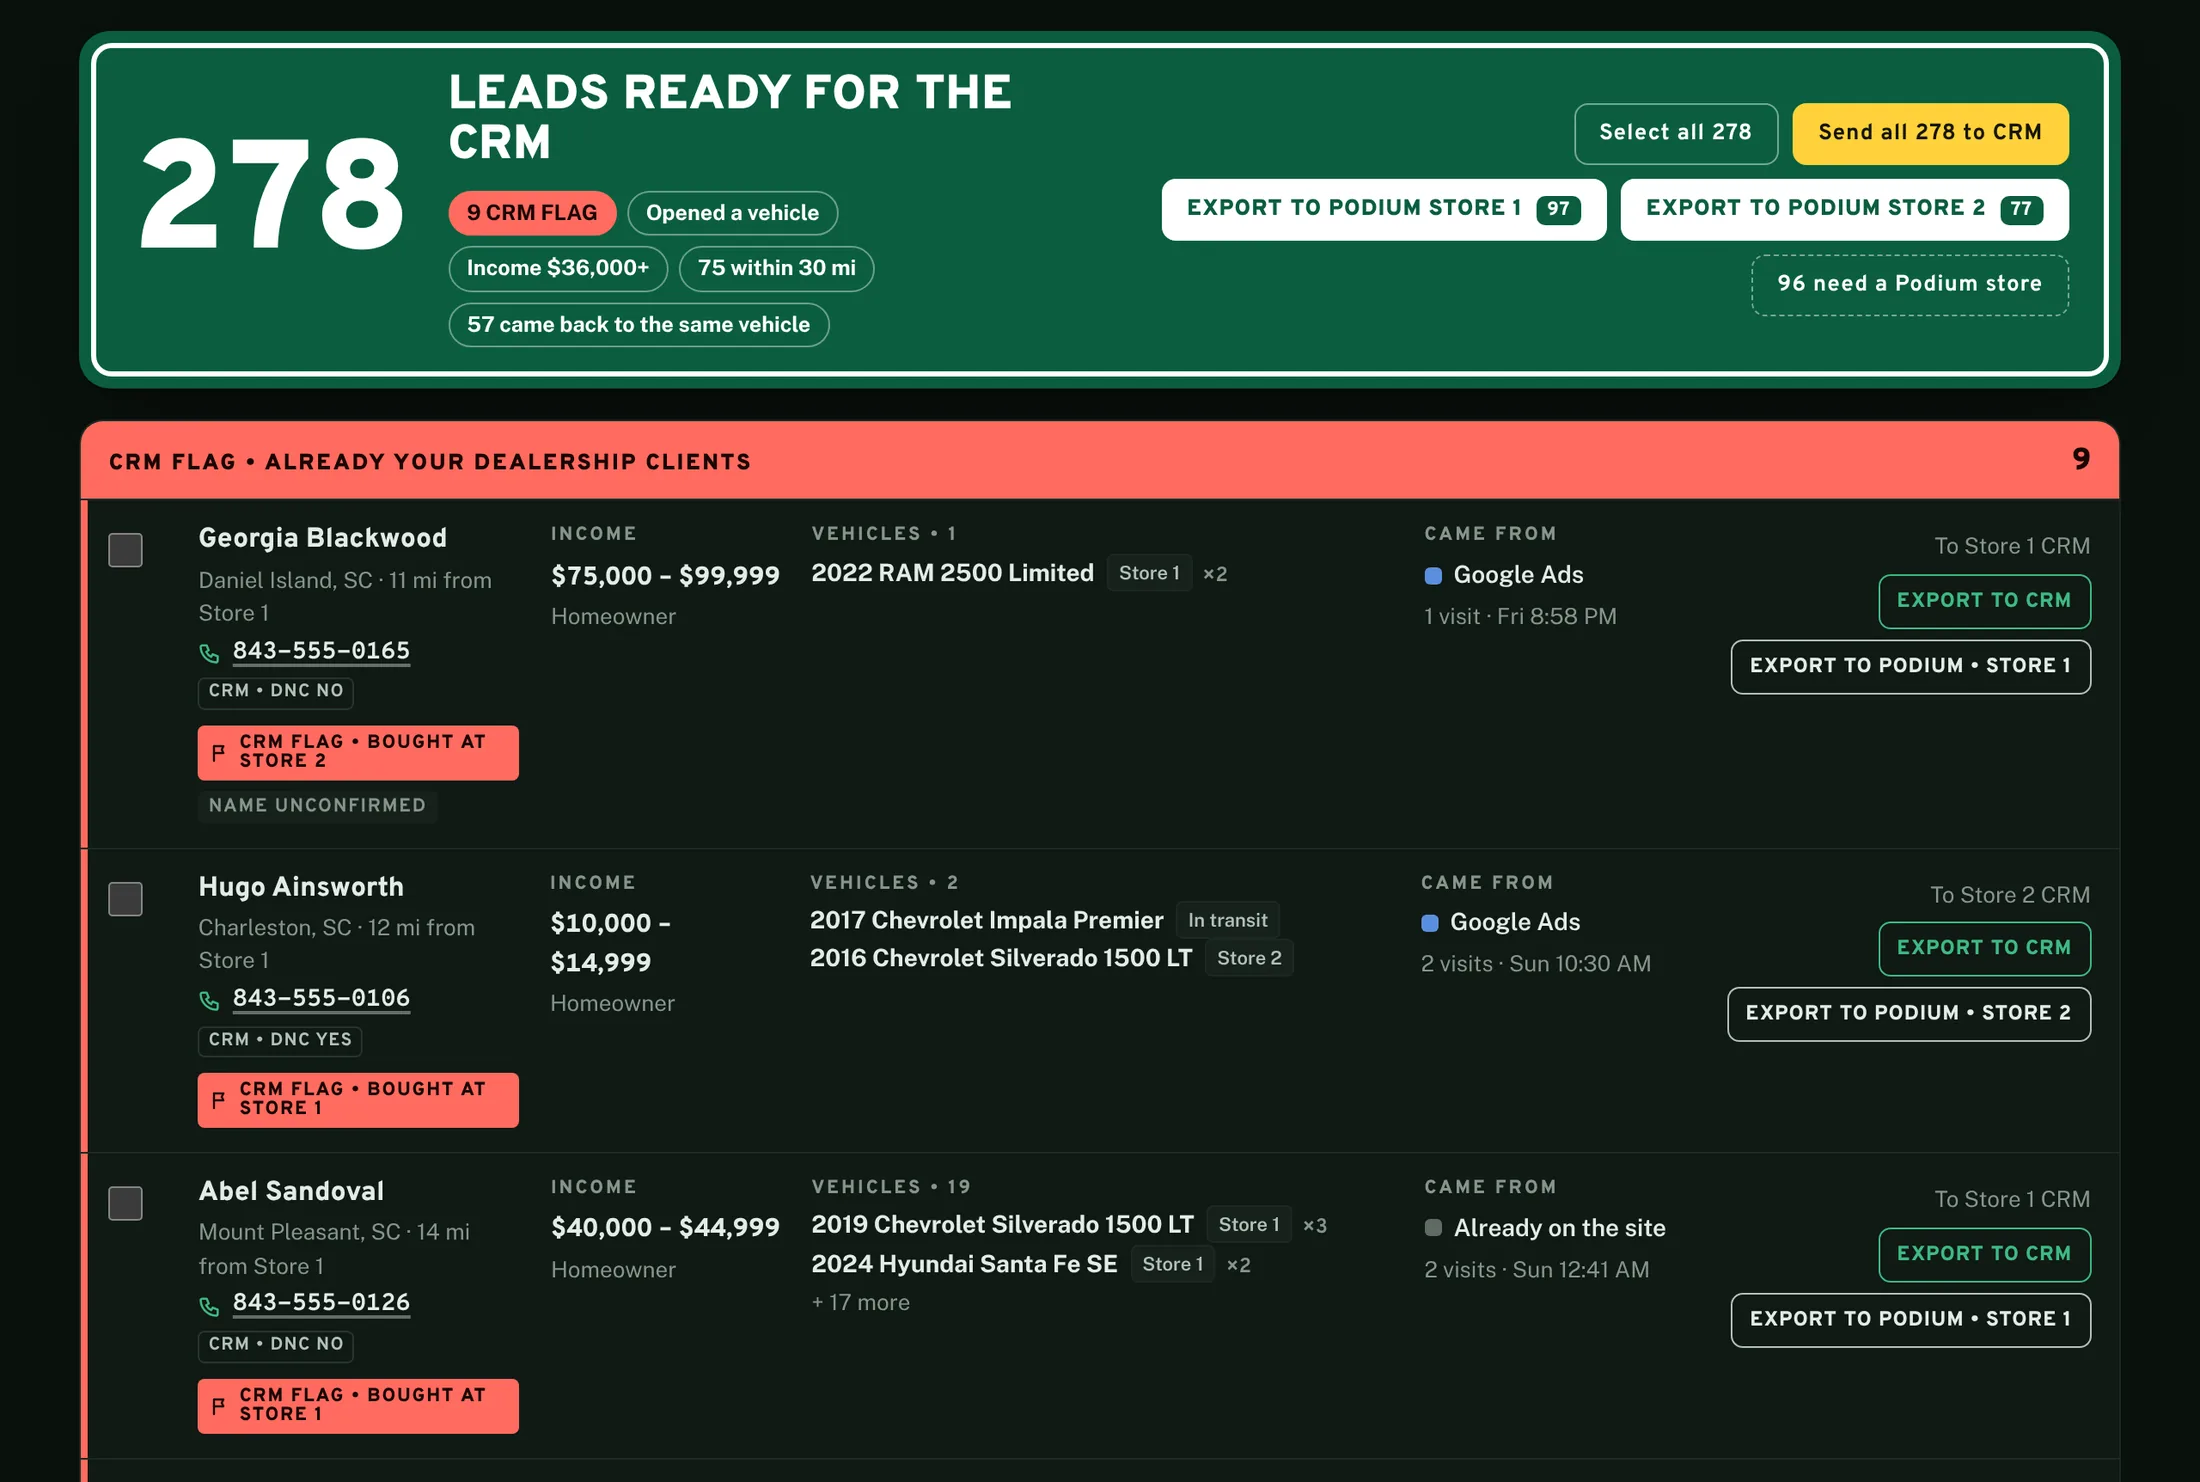
Top leads. A green sign reads 278 leads ready for the CRM: 9 CRM flag, opened a vehicle, income 36,000 dollars or more, 75 within 30 miles, 57 came back to the same vehicle. Sample past customers are listed first with income range, vehicles opened, source and export buttons.
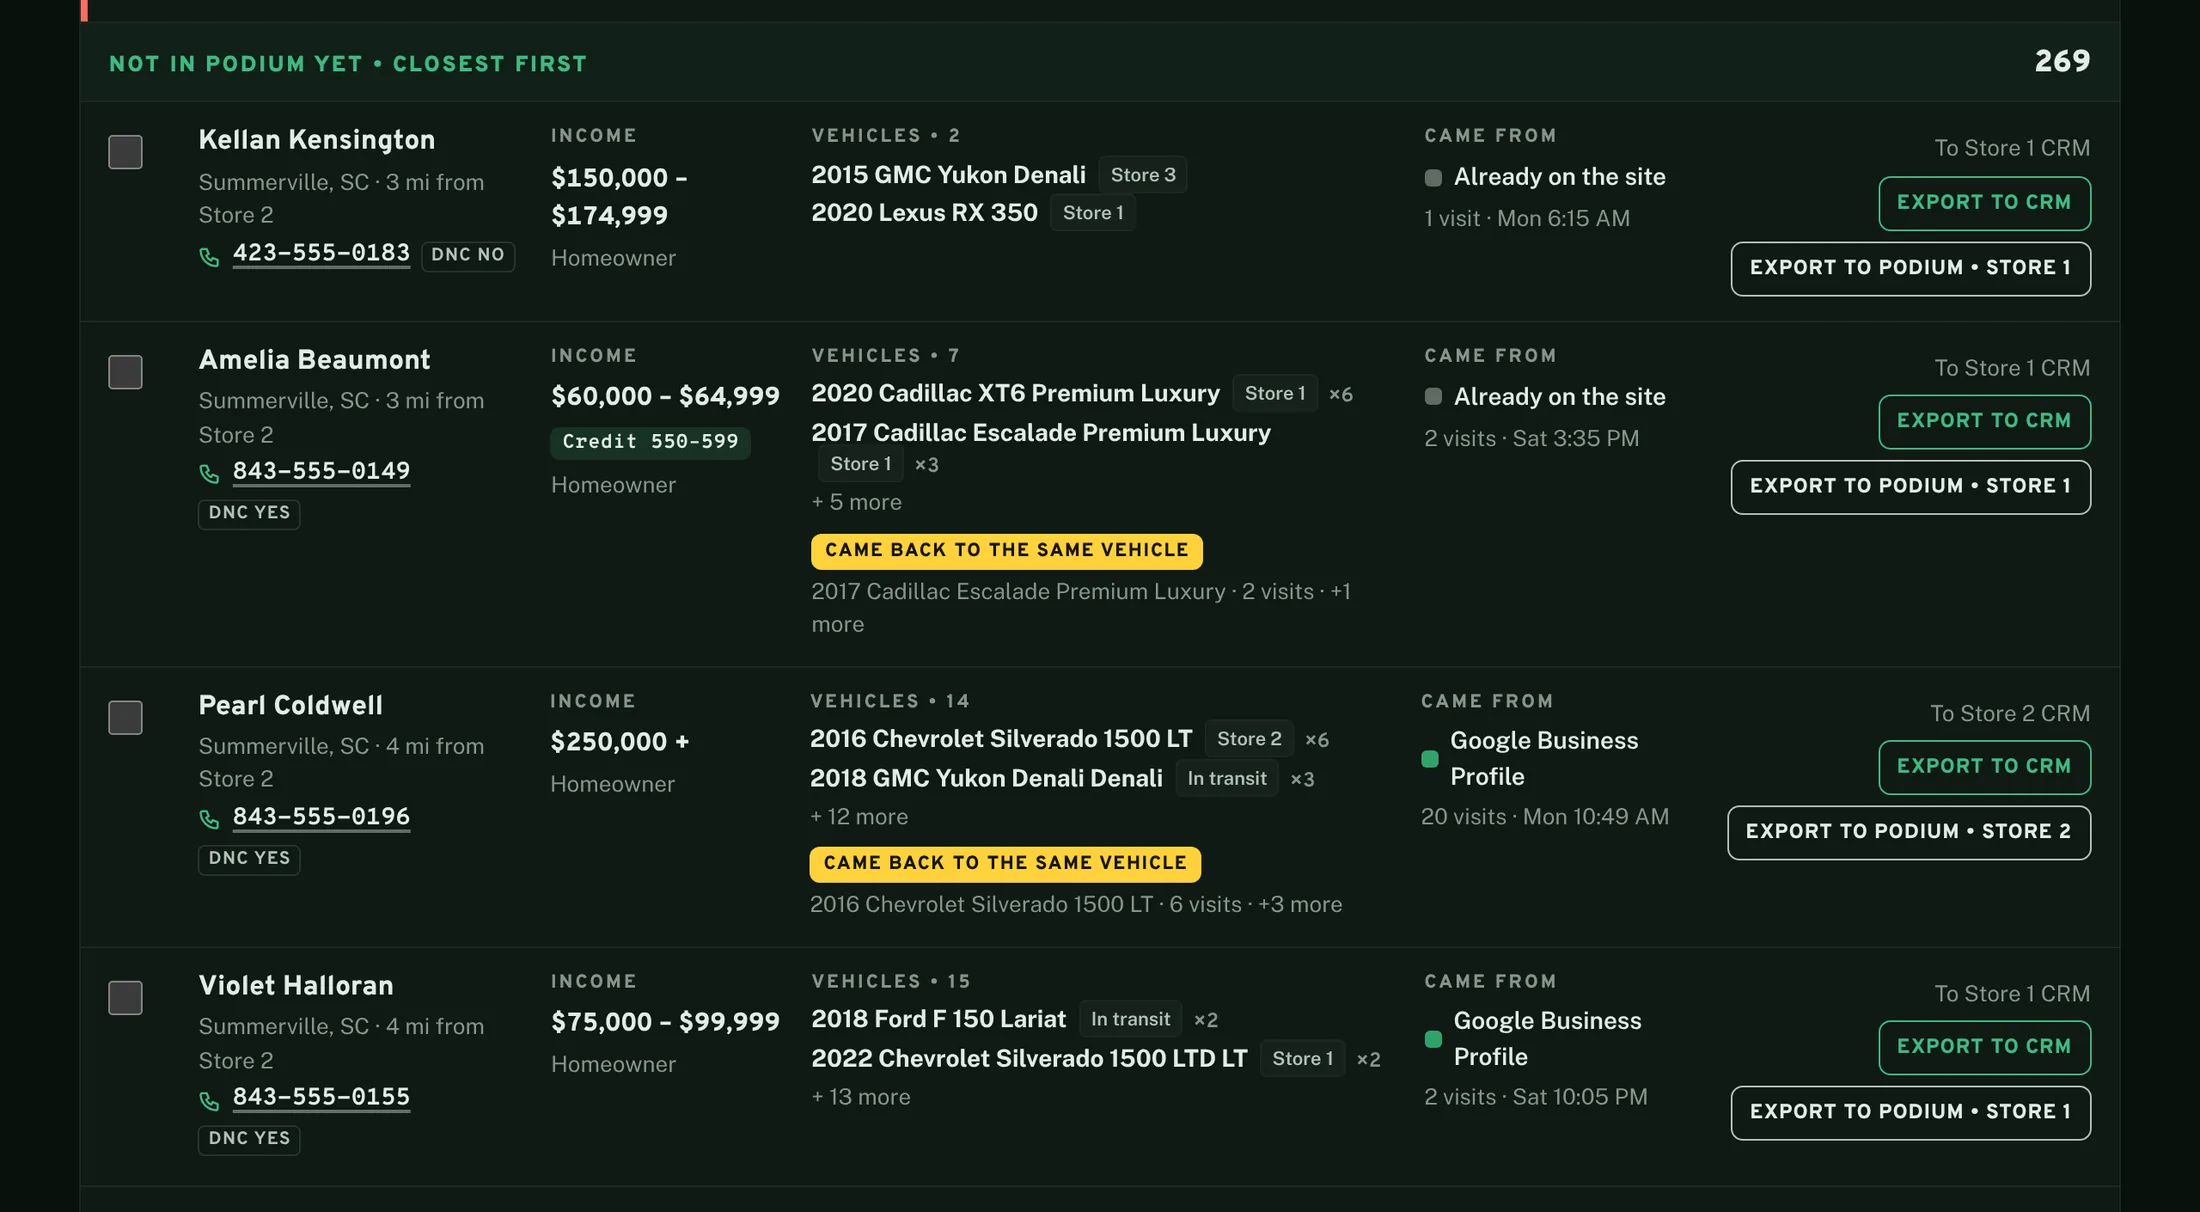
More sample top leads, closest first. Each row shows a tap-to-call number with its Do Not Call status, household income, an estimated credit range where one is on file, the vehicles opened and which store they sit on, whether the shopper came back to the same vehicle, and where they came from.
Each row: a number to tap with its Do Not Call status beside it, household income, an estimated credit range where we have one, the vehicles they opened and which lot they sit on.
274
shoppers opened a vehicle and have a household income of $36,000 or more
71
of those live within 30 miles of a lot
72
of those have a household income of $100,000 or more
124
shoppers carry an estimated credit range
Inventory and ads

Every vehicle with a name on it. Every ad with a name on it.

The same data answers two questions a dealer usually guesses at: which units are getting attention, and which advertising brings real people.

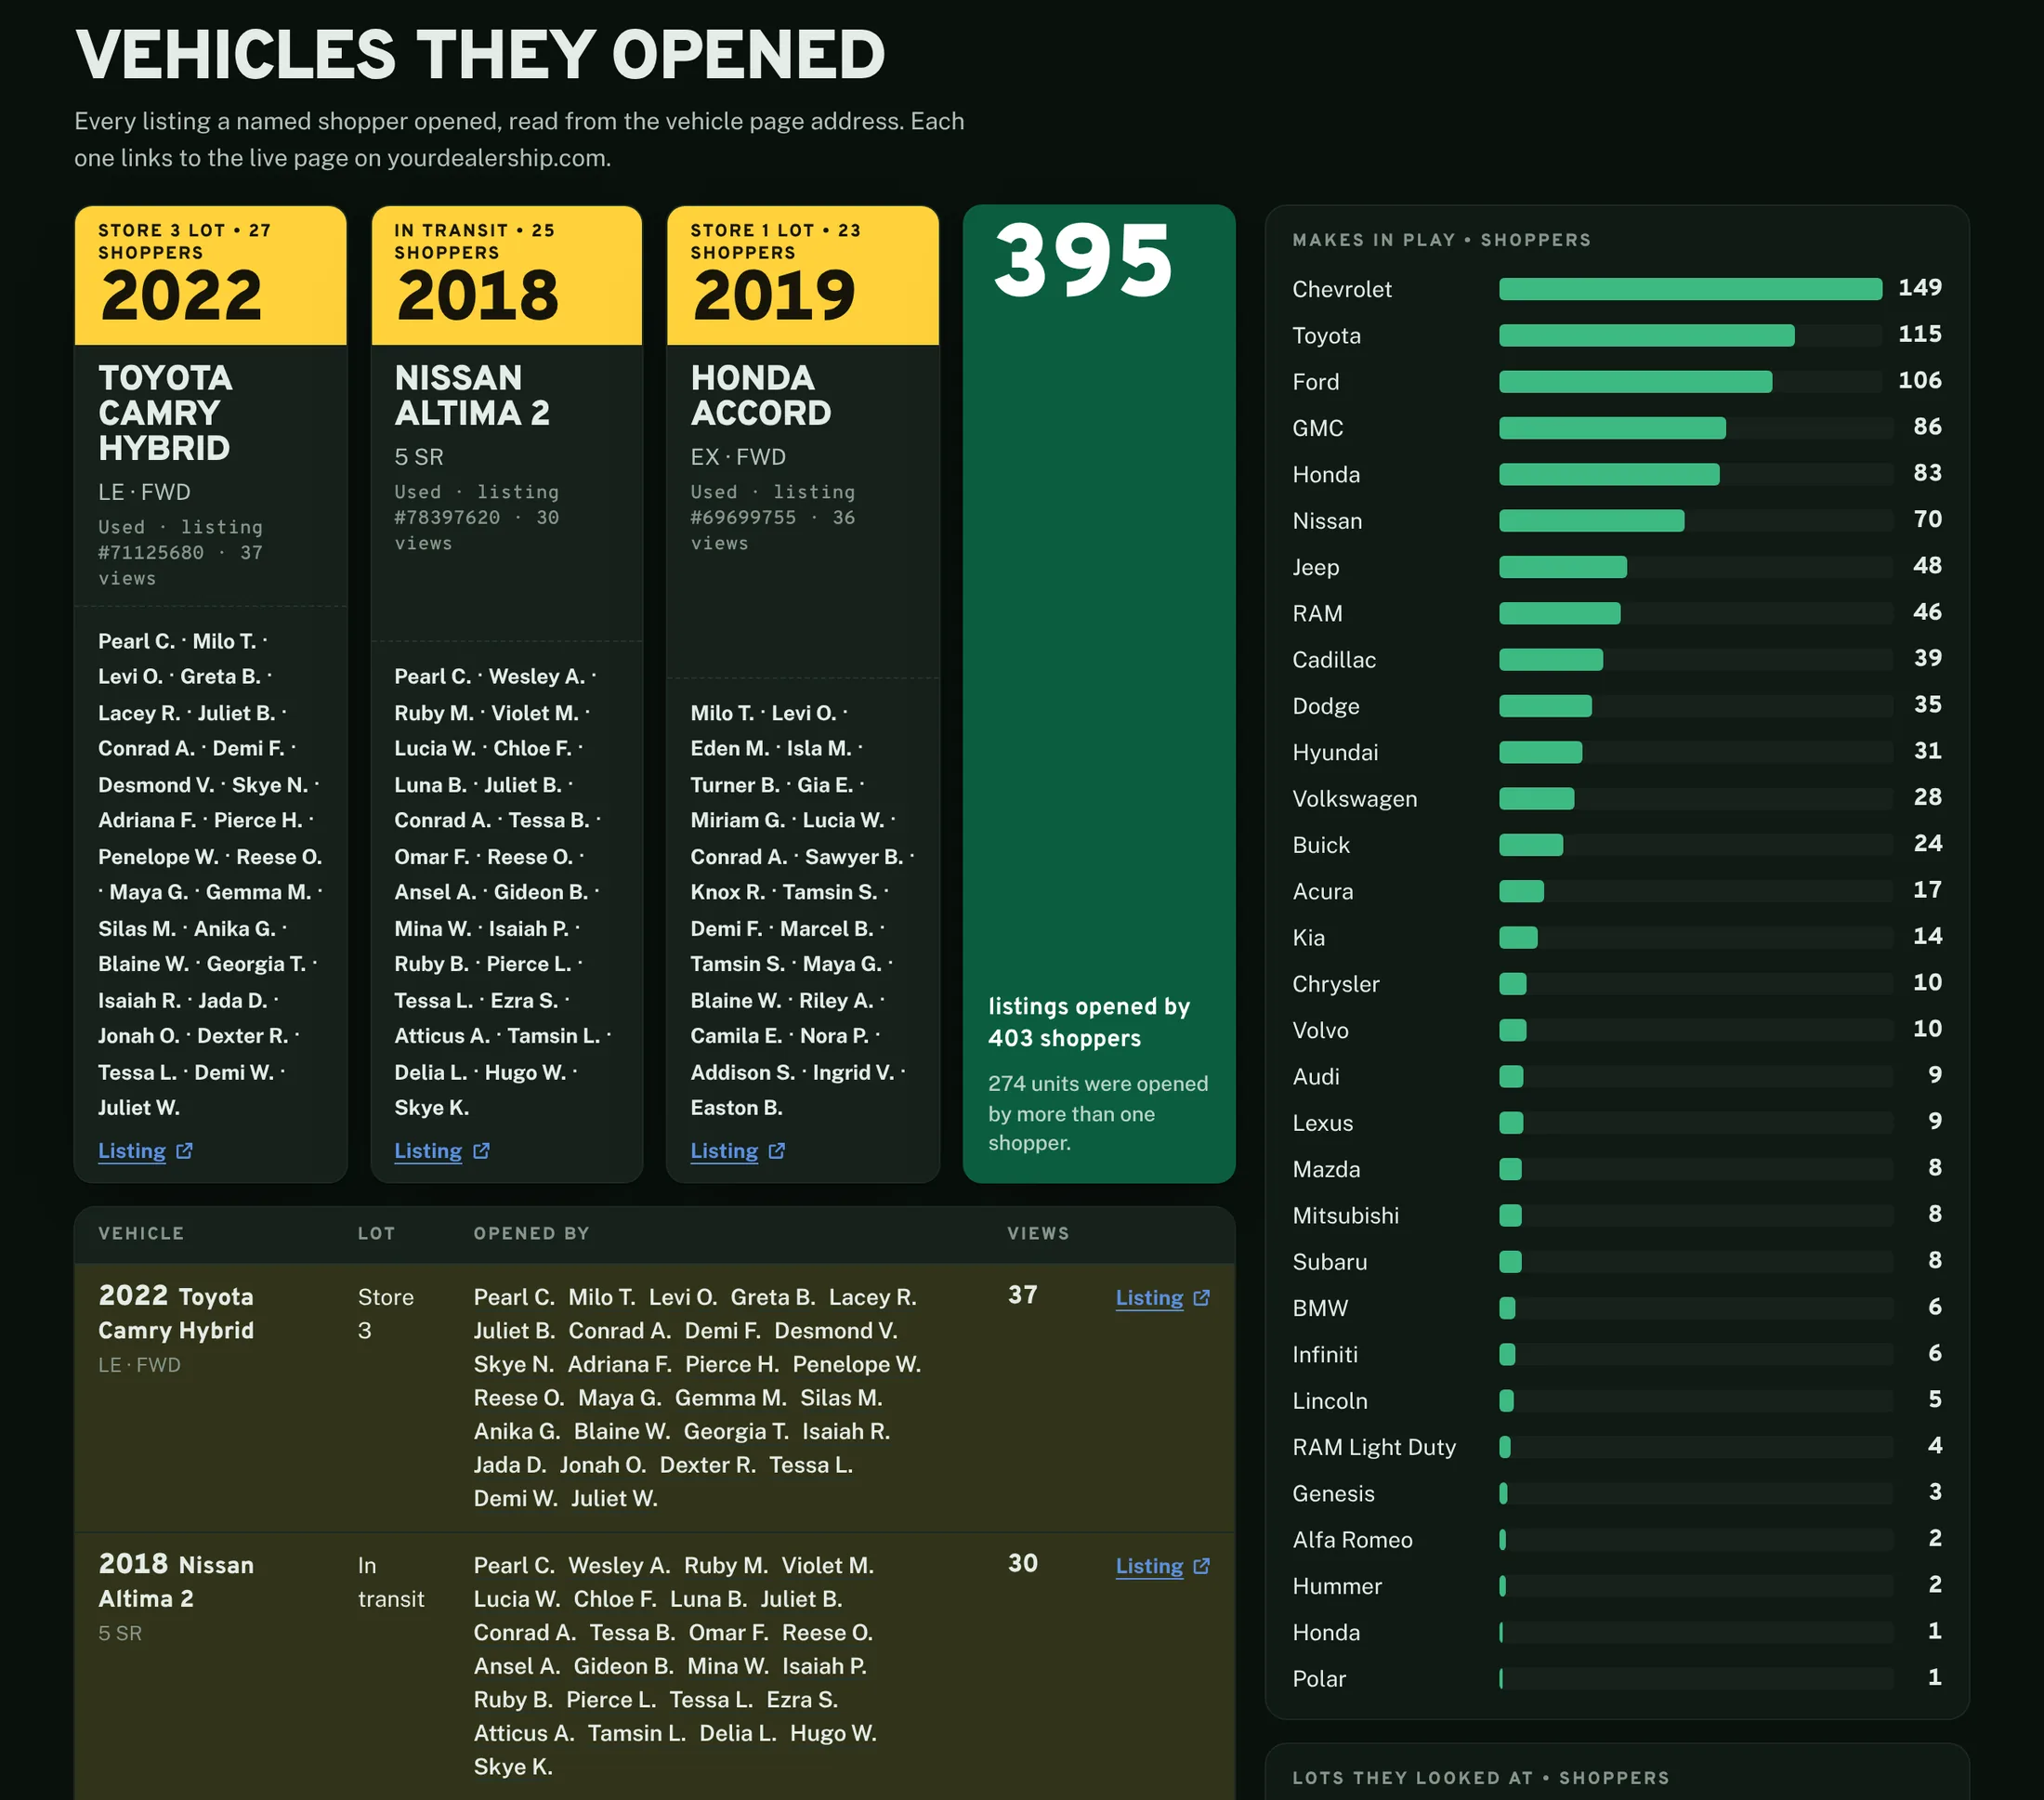
Vehicles they opened. The most-viewed units, a 2022 Toyota Camry Hybrid, a 2018 Nissan Altima and a 2019 Honda Accord, each list the sample shoppers who opened them. A chart of makes in play is led by Chevrolet with 149 shoppers, Toyota 115 and Ford 106.
395 different vehicles were opened. When two different people open the same unit, it rises to the top of the list.
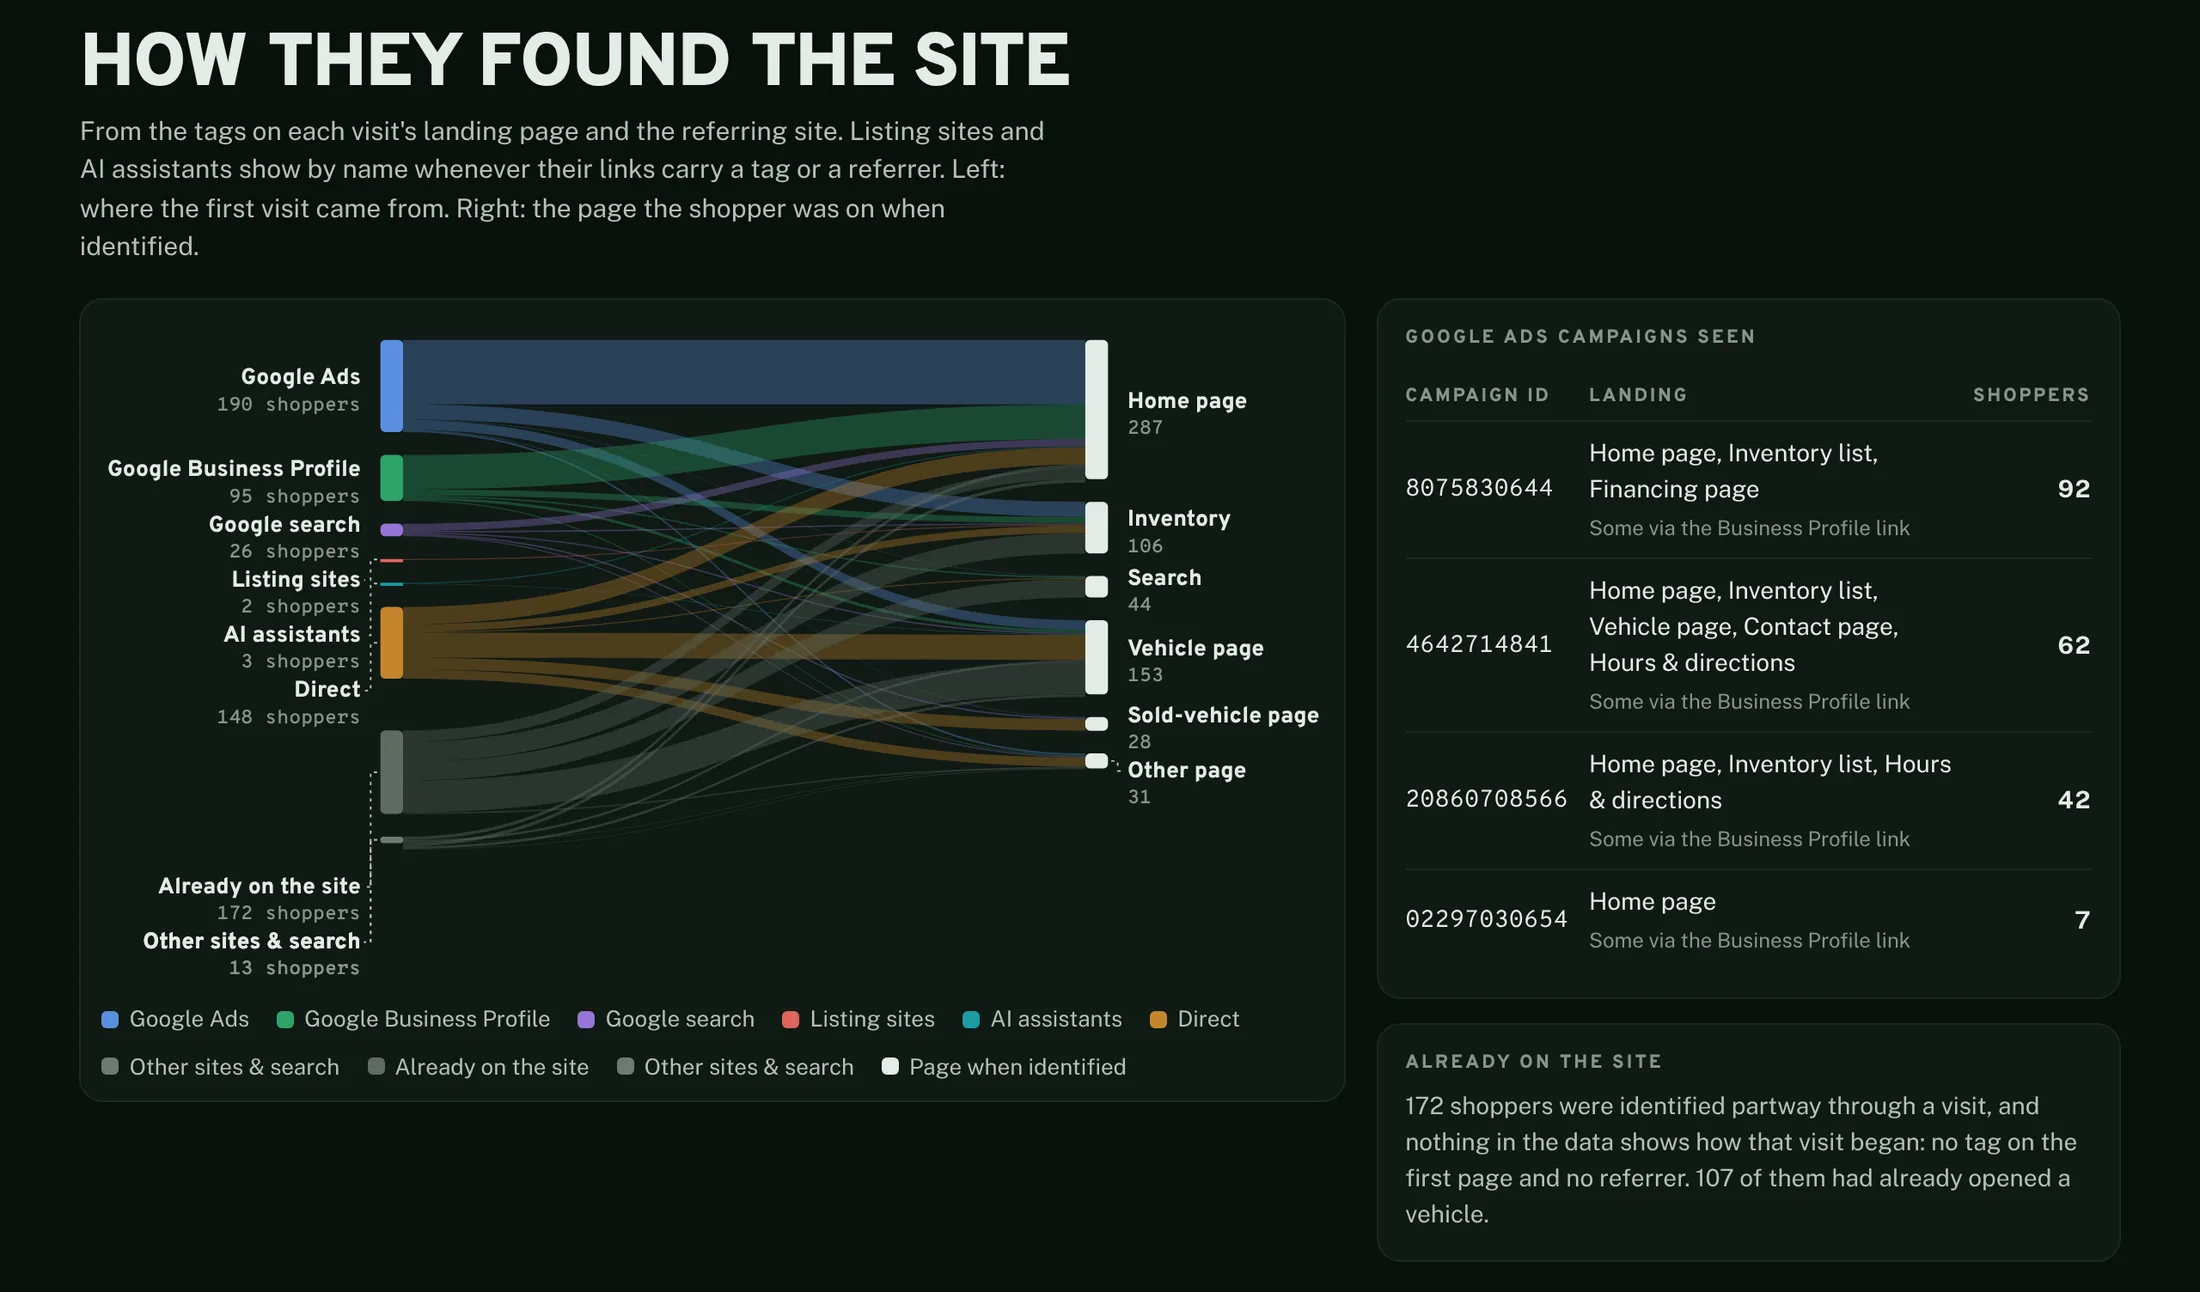
How they found the site. A flow chart from source to the page each shopper was identified on: Google Ads 190 shoppers, Google Business Profile 95, Google search 26, direct 148. A table lists Google Ads campaigns with the shoppers each one brought.

Where the named shoppers came from

  • Google Adsnamed shoppers arrived from Google Ads190
  • Directcame directly148
  • Google Business Profilefrom the Google Business Profile95
  • Google searchfrom Google search26
  • ChatGPTfrom ChatGPT3

172 more were first seen partway through a visit, with no entry source.

Inside the store's tools

Built around how the sales team already works.

  • Each lead is prepared as a standard CRM lead and routed to the store whose cars the shopper opened
  • An export for the store's texting platform, one per store, that never sends the same number twice
  • Spreadsheets of uncalled leads for the sales managers, split by store
  • Find a lead by name or by any part of a phone number, for when someone texts back
  • A follow-up log on every lead: Called 1, 2, 3, Texted, Appointment, Sold, Remove, with notes. The least-touched leads sort to the top
  • A button that hides every name, for showing the desk on a screen

Changes ship the day they are asked for

  1. The dealer's customer lists arrive. The CRM flag goes live.
  2. Past customers shopping elsewhere are added to the desk.
  3. The dealer's own CRM record leads every matched lead. The shared follow-up log goes in.
  4. A flagged lead stays on the desk until the dealer removes it.
  5. Every phone number becomes a call link.
  6. Spreadsheet exports requested at 9:44 AM. Live about 10:00 AM.
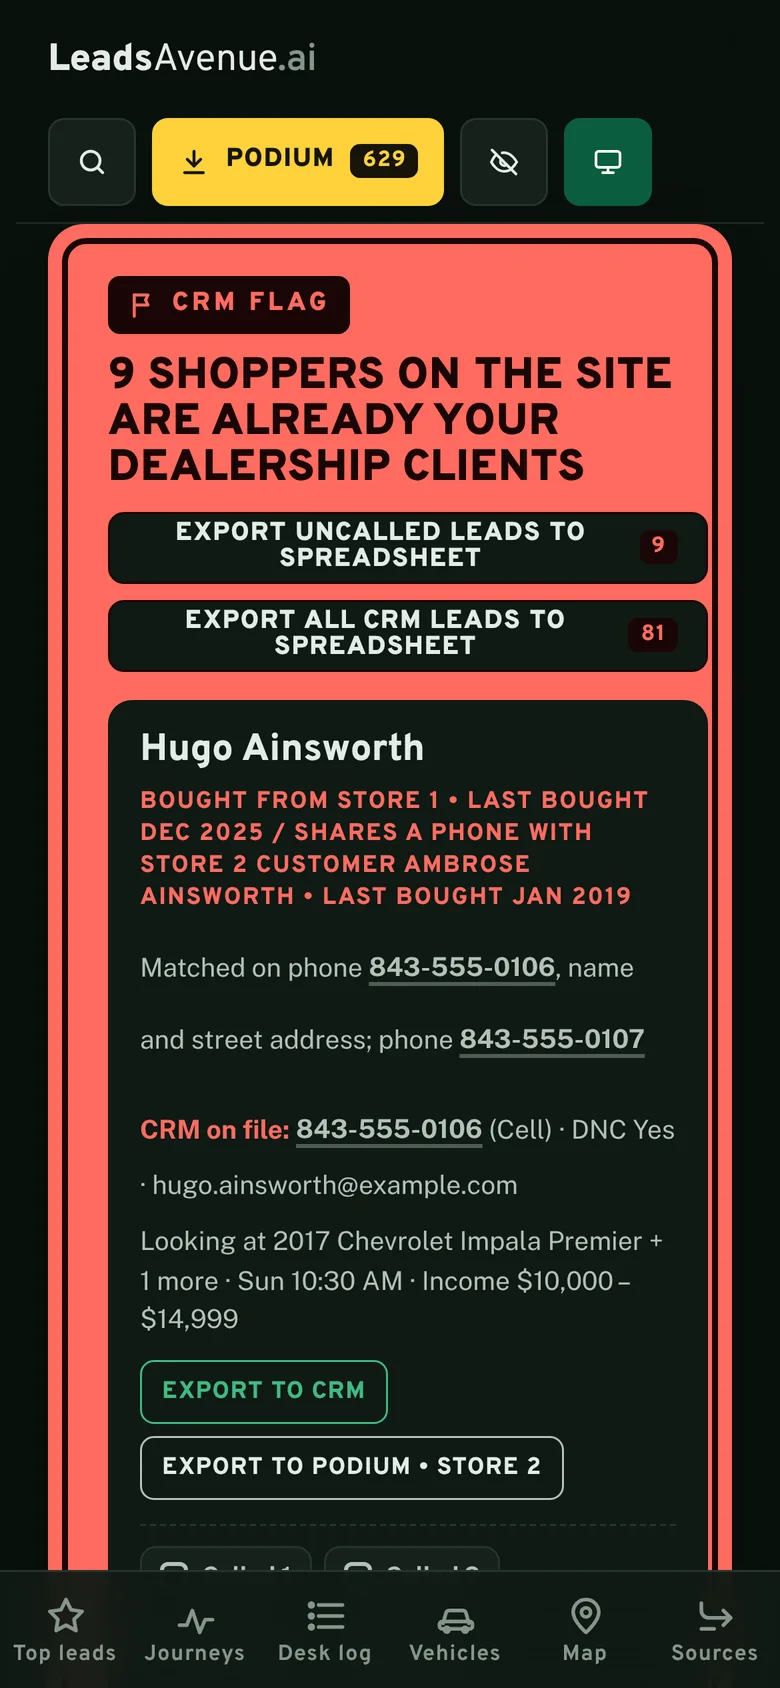
The same desk on a phone: the CRM FLAG panel and a sample customer card with numbers to tap and call.
The same desk on a phone.
The other half

The pixel finds the shoppers on your site. The lead file finds the ones who have not reached it.

For two other stores we built the outside-in half: named households inside the store's real trade area who are shopping that brand right now, each record tested against itself before delivery.

A Ford store in the Mid-South

3 of 40
ZIP codes around the store where it is the nearest Ford dealer. Proximity was not its edge. Knowing first is
200
households delivered from 865 model-shopping signals, each one also on the active-shopper list that week
8
at the very top: on six or more model lists, estimated credit 750 or higher, six-figure income. Eight phone calls, one morning
47% → 20%
records that contradicted themselves, before and after the scrub

A Honda store in Los Angeles County

23
Honda dealers in the county mapped, to find the 33 ZIP codes where this store is the convenient choice
588
verified households in the finished file, from 1,790 raw rows, with a tab for each model they were shopping
470
of them with a phone number that can be called on day one
45.4% → 12.1%
records that contradicted themselves on the buyer's own age, before and after
Straight talk

What is not proven yet.

No sales are counted here.

The desk is about ten days old. We have not tallied appointments, cars sold or revenue from these leads, so this page claims none.

649 is a count, not a rate.

The pixel names the visitors it can match. Total site traffic was not measured here, so there is no match rate to quote.

The names on screen are invented.

The screenshots show the working desk with sample people and replaced store names. The totals, the vehicles and the behavior are real.

For dealerships

Take seven days. Keep the file either way.

We put one script on your site and build a verified lead file for your trade area. At day seven you see who was on your website and who is shopping your market, measured against the cost per sold unit you give us on day one.

See who's on your website